Overview
I wanted to challenge myself to learn more about bridge design, so I decided to use a cantilever truss. My design is inspired by the Forth Rail Bridge in Scotland, which is pictured below:

Truss Design
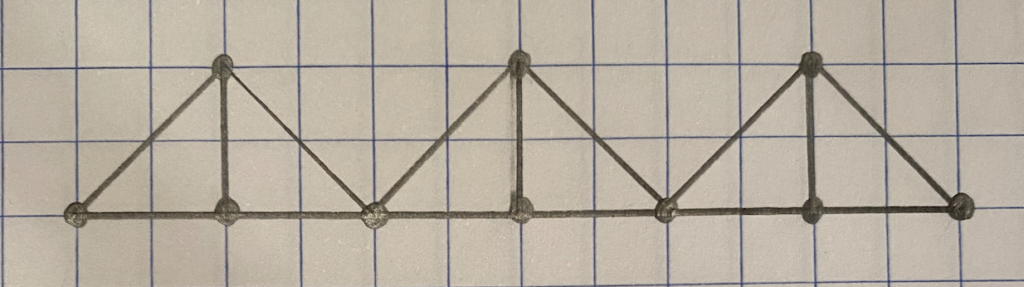
The basic structure of the cantilevered truss design is illustrated below:
I filled in the basic structure with target dimensions for my physical model and reaction forces:
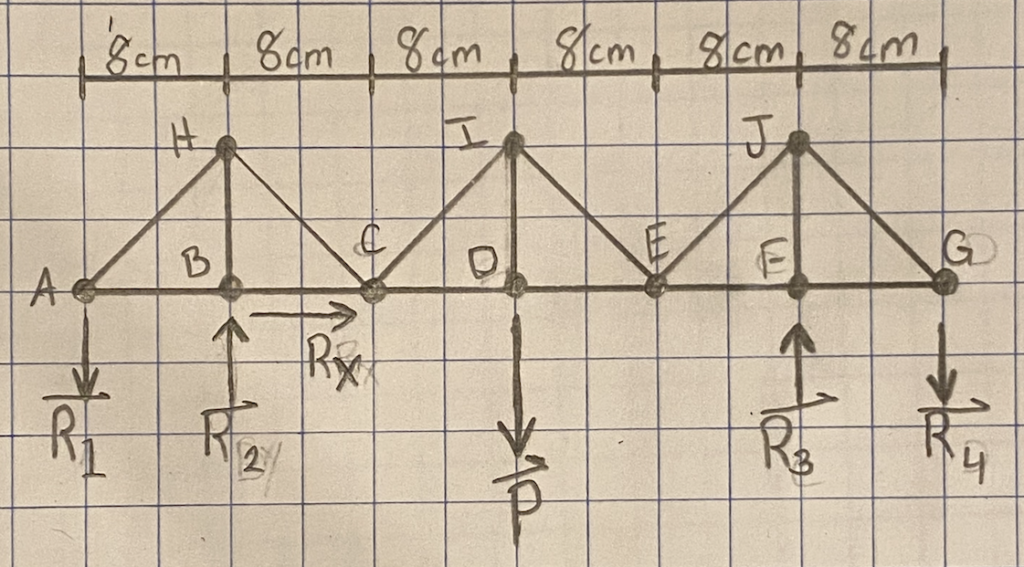
The direction of the reaction forces is dependent on the placement of the principal load P, so I included the principal load P in the above diagram. There are five reaction forces: one to stabilize the structure horizontally, and four to support the structure vertically.
Relative to a simple supported truss, a cantilevered truss requires two additional reaction forces to be statically determinate. This is because the truss does not have enough members to be statically determinate with only three reaction forces. In the above diagram, the cantilevered design is achieved by effectively “trading” members HI and IJ for additional reaction forces at joint A and joint G. If these additional reaction forces are not present, the structure is not stable and will collapse. I demonstrate this behavior in the section on the Truss Model
Static Determinacy
M is the number of joints, N is the number of linkages, and R is the number of reaction forces. Although a 3D model of the truss will be created, the truss design itself is planar (2D). Therefore, the truss design is statically determinate if and only if 2M = N + R.
| M | N | R | 2M | <= or > | N + R |
| 10 | 15 | 5 | 2M | = | 20 |
2M = N + R \\
2(10) = (15) + (5) \\
20 = 20\\
\checkmark
The cantilevered truss is statically determinate.
Free Body Diagrams
The free body diagram for the entire truss is pictured below:
The principal force P is positioned exactly in the center of the truss design, directed downward at joint D. To reduce the calculations required to determine the magnitude of the reaction forces in terms of P, I have separated the truss into three sections:

Expected Reaction Forces
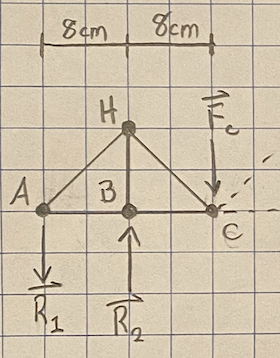
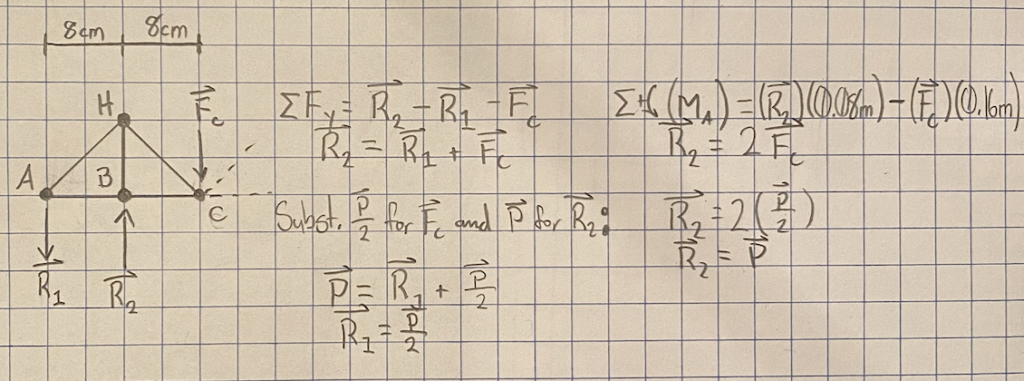
To reduce the calculations required to determine the magnitude of the reaction forces, I focus on the center section first to determine the internal reaction forces at joint C and joint E:

Next, I use the calculated Fc to determine R1 and R2:
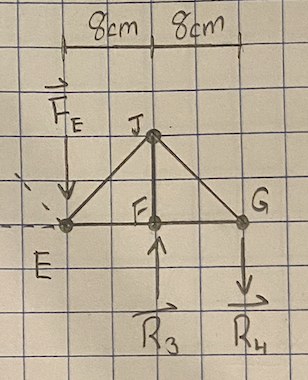
Finally, I used the calculated FE to determine R3 and R4:

Below is a summary of the expected loads based on the above truss analysis. Note that Rx is always 0N because there are no external forces with a horizontal component:
| Applied Load | Reaction 1 | Reaction 2 | Reaction 3 | Reaction 4 |
| P N | 0.5P N | P N | P N | 0.5P N |
Model Fabrication
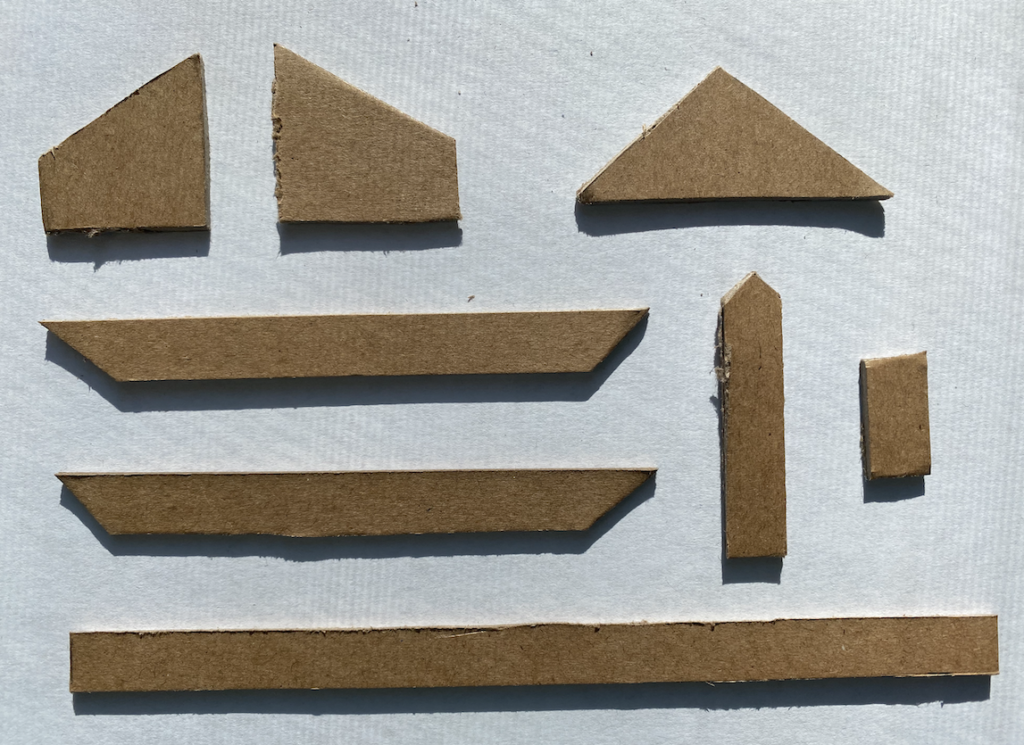
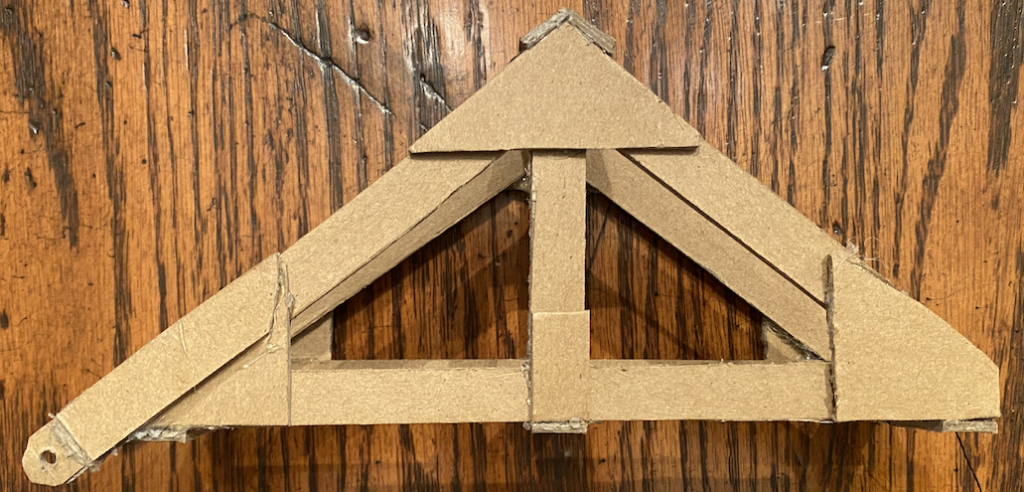
The cantilevered bridge design consists of three identical sections that are joined together with pin joints. The pins are small wooden skewers, and additional cardboard beams are attached to each section to create double-shear pin joints which can rotate freely. Below are the beams and gusset plates for one half of a section:
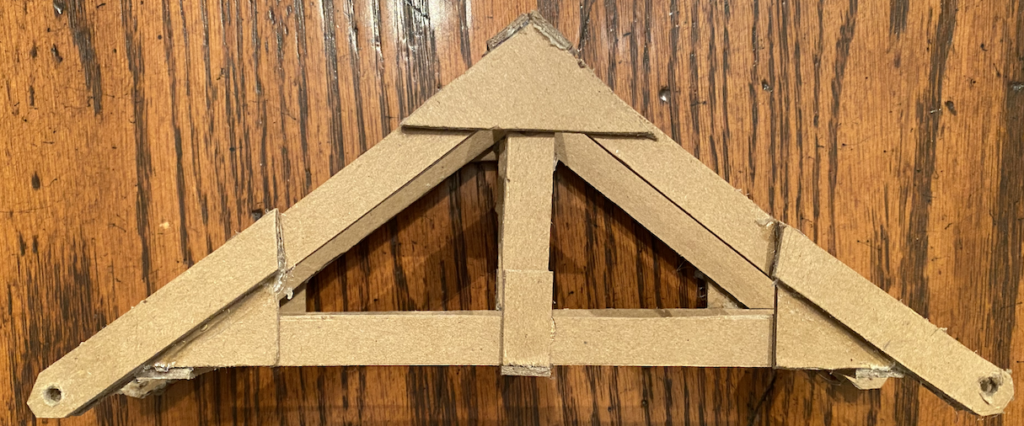
An assembled half-section is pictured below:

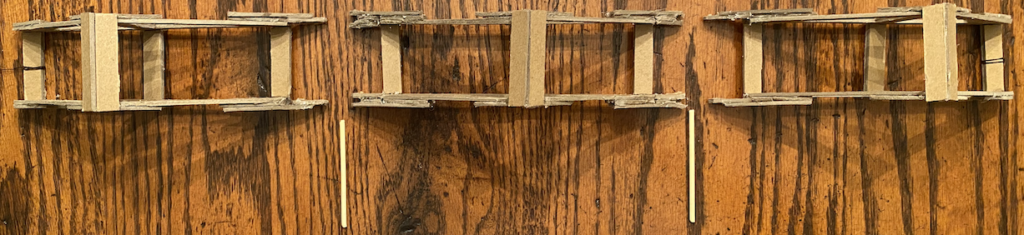
The main structure of all three sections is the same, but each section has slightly different connections at their ends to interface with the pin joints. Below is the left-section, note the pin-holes on the right side:

Below is the middle-section, note the pin-holes on the both sides:
Below is the right-section, note the pin-holes on the left side:
Below are the three sections placed next to each other, with the wooden pins placed to the side. Note the string attached to the beams representing joint A and joint G. These will be used to apply the downward reaction forces at those points:
Below is the assembled cantilevered bridge truss:
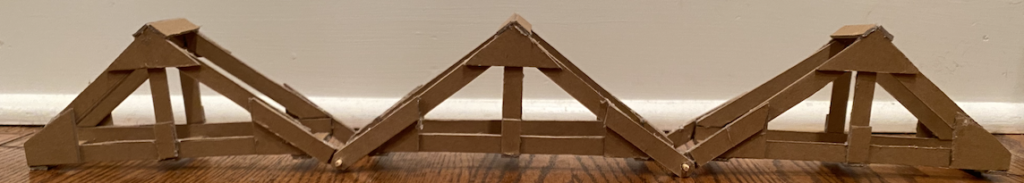
As discussed earlier, the cantilevered truss requires two additional reaction forces at joint A and joint G to be statically determinate. If these additional reaction forces are not present, the structure is not stable and will collapse, as demonstrated in the image below:

When the necessary reaction forces at joints A and G are present, the cantilevered truss is stable.
Force Measurement
Once I made a physical model, I measured each reaction force to ensure that my analysis of the truss was accurate.
Testing Apparatus
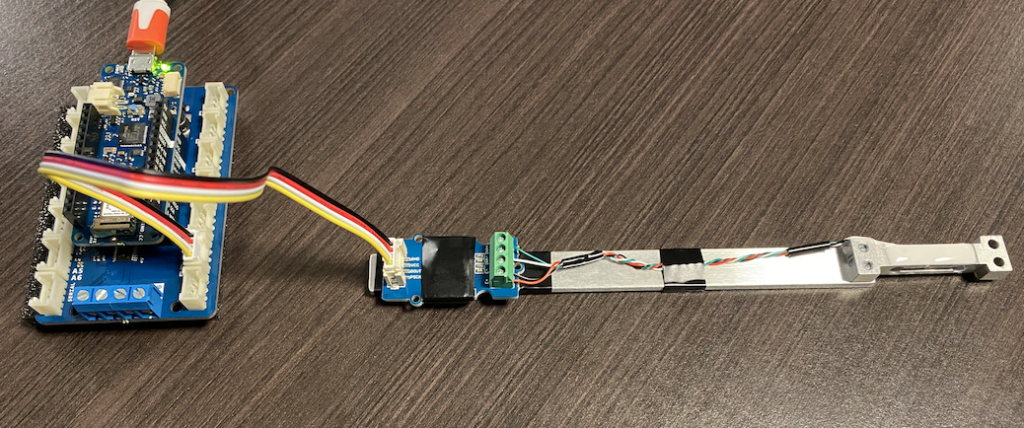
I secured a TAL221-500 loadcell onto one end of a thin aluminum bar with screws, and a Grove ADC chip to the other end with electrical tape. There are a few solder pads protruding from the underside of the Grove ADC chip, so I wound some electrical tape around the aluminum bar before securing the chip to prevent short circuits. The measurement assembly is pictured below:
To position the bridge such that I could reliably measure the reaction forces, I made three layered cardboard shims to put underneath joint B and joint F. The two thicker ones are used when measuring the reaction force R1 and R4. When measuring either R2 or R3, the correspond thick shim is swapped with the thin shim to make space for the loadcell. The shims are pictured below:
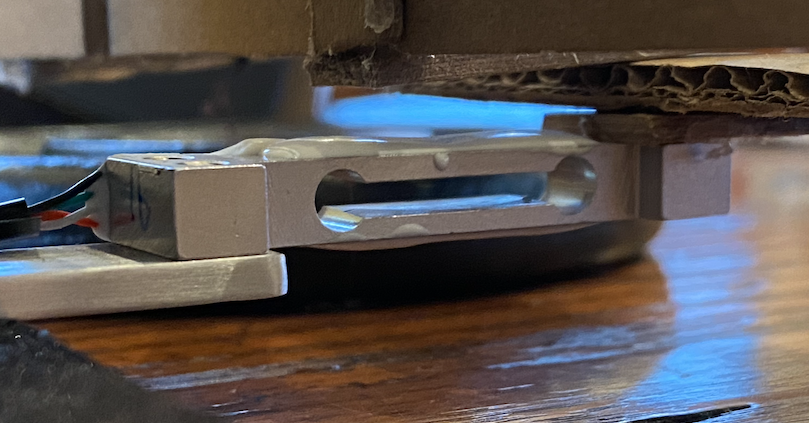
Below is a picture of the loadcell at joint B measuring R2 (the same setup is used to measure R3). Note the use of the thinner shim:
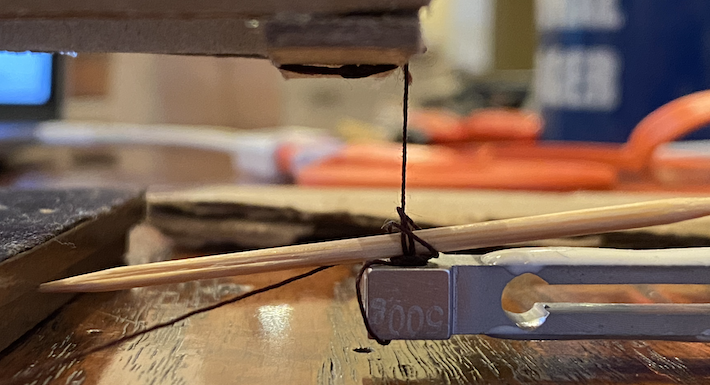
Below is a picture of the loadcell tied to joint G measuring R4 (the same setup is used to measure R1). The force is directed upwards, so the reported forces will all be negative (the sign is ignored). The toothpick is used to increase the tension in the string to level the truss. When not measuring R1 or R4, the string is tied to a 1.5lb plate weight.
Results
Note that the measurement assembly was reset (using the onboard reset button) and tared each time the loadcell was repositioned to measure a different reaction force. Consequently, there is no need to subtract out the weight of the truss after recording measurements.
I used four 25.2 gram weights, each constructed of 5 nickels and 0.2 grams of tape.
| Applied Load | Reaction 1 | Reaction 2 | Reaction 3 | Reaction 4 |
| P N | 0.5P N | P N | P N | 0.5P N |
| 0 N | 0.0034771150 N | 0.0025267711 N | 0.005507523 N | 0.002675356 N |
| 0.247212 N | 0.1278146801 N | 0.284746273 N | 0.267705990 N | 0.113090644 N |
| 0.494424 N | 0.268232658 N | 0.553833875 N | 0.514905077 N | 0.229365935 N |
| 0.741636 N | 0.399472228 N | 0.824574258 N | 0.765470632 N | 0.3481582617 N |
| 0.988848 N | 0.5583521910 N | 1.094240304 N | 1.0129132776 N | 0.4687526119 N |
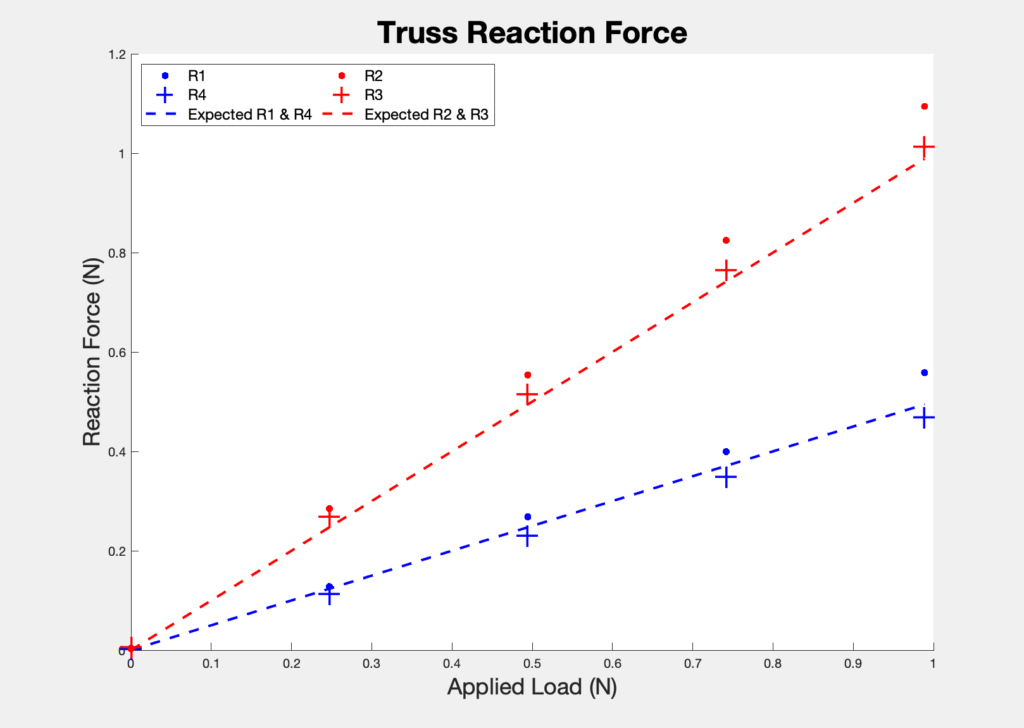
The graph clearly indicates that all four reaction forces increase linearly with the applied load. The measured data and the analytical model agree. The dimensions of the physical model truss are slightly different from the intended dimensions used in my computational analysis. The only dimensional differences that cause discrepancies are those in member BC and member EF, which are both 1.5cm longer than intended. The effective length of these members is increased because the pin joints joining the three sections are offset from the core structure of each section. Consequently, R1 and R4 are greater in magnitude in the physical model than in the analytical model. I’m confident that the discrepancies from the analytical model are caused by dimensional deviations in the physical model.
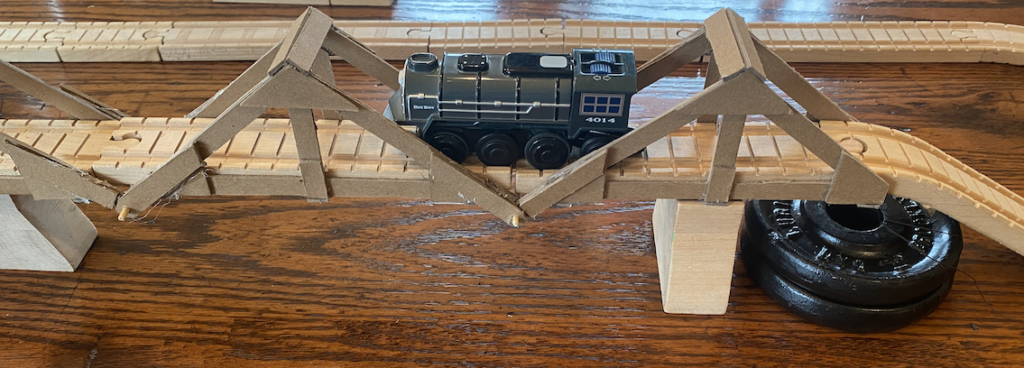
Model Railway — Just for Fun!
As mentioned earlier, my truss design is inspired by the Forth Rail Bridge in Scotland. When constructing my bridge I was careful to ensure that there was enough space to fit some wooden rails and a battery-powered train. Pictured below is my bridge in action!
